


Overview of Monitoring
Monitoring itself has a lot of meanings to different individuals and also has different aspects associated with it as per your business functions and strategy and it also means a plethora of things to different professionals even in the tech domain. For example, a systems administrator views monitoring from a different perspective than a QA engineer or a business strategist. However, in simple terms monitoring or Observability as it may be interchangeably called, means getting an indebt overview of the performance of your system in terms of metrics, logs, traces, and the visualization of the aforementioned. Basically, it's safe to say that monitoring is the ability to keep an eye on the events and data that move between and across your system infrastructure. The value of monitoring can not be overemphasized as it helps an organization in gaining valuable insight into system data/metrics and logs which in turn helps in making critical decisions that impact the organization.
Objective
For this exercise, we will be setting up and working with Prometheus as a monitoring tool along with Grafana for visualization. now let's dive in and get an understanding of each of these tools.
Prometheus
Prometheus is a pull-based monitoring tool (i.e it pulls metrics from the systems/applications which it intends to monitor) that is developed by SoundCloud in 2012 and donated to CNCF. It is an open-source tool and it is designed to collect system(Kubernetes/docker/server) information or metrics data. It has a built-in querying language called PromQl that allows you to do all sorts of aggregations, analysis, and arithmetic, allowing you to better understand the performance of your system from your metrics. Prometheus comes with a pre-built alerting tool that saves you time from looking for other third-party tools to handle alerting tasks. Generally, it's a really cool tool, and it's performant and simple to run.
Grafana
Grafana is an open-source visualization platform where you can create various kinds of dashboards with graphs and charts. It supports time-series data and integrates seamlessly with Prometheus. The use case of Grafana can also be expanded with plugins and code customizations which will allow you to use it with different databases. Grafana makes the process of visualizing your data very enjoyable.
Prerequisites
In order to achieve the above steps we would need to have the following;
- Server/machine that allows access on ports 9090, 9100 and 3000
- Ansible for automating the installation of Prometheus
- A terminal, git bash preferably.
Setting up our environment
You can use your local machine to follow along with this demonstration but i wouldn't recommend that. However i would be using an EC2 instance in AWS to show the awesome powers of monitoring/observability with Prometheus and Grafana respectively, so if you have an AWS account and access to AWS resources, you can follow along as well. Create an Ec2 instance with the following properties;
- AMI: Ubuntu Server 20.04 LTS (HVM), SSD Volume Type
- Instance Type: t2.micro
- VPC: Default
- Tags: Key = name, Value = Host machine
- Security Group: Host machine SG
- Keypair: Create new or existing
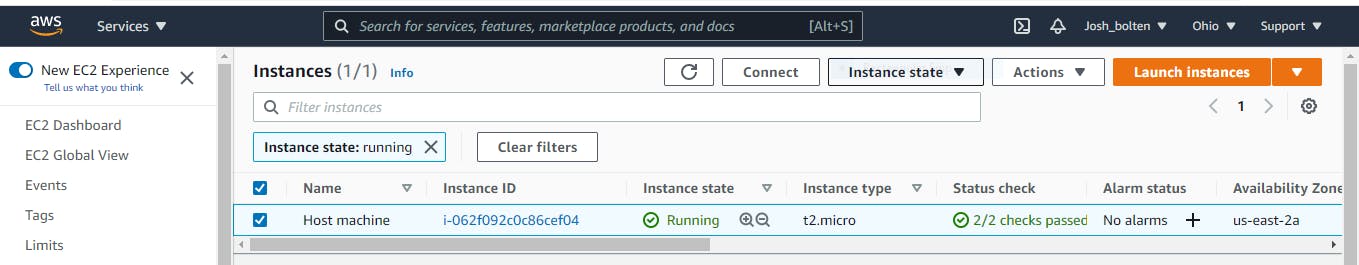
NOTE: The security group should allow ingress traffic on ports 9090,9100,3000 and 22 for SSH. After following the above step you should have a functioning EC2 instance as shown below
Now our environment is set let's go ahead with the installation of our favorite tools. Firstly you need to ssh into the Ubuntu machine that you have provisioned above, from your terminal run;
ssh -i "<your private key.pem>" ubuntu@ <machine ip>
I will be using Ansible to automate the installation of Prometheus. Before that, you need to make sure ansible is installed on your machine. To do that you can run the following commands;
  sudo apt-get update
  sudo apt-get install software-properties-common
  sudo apt-add-repository --yes --update ppa:ansible/ansible
  sudo apt-get install ansible
  sudo apt install python3-jmespath
Now that ansible is up and running, clone the repository containing Prometheus files;
git clone https://github.com/cloudalchemy/ansible-prometheus
run the following commands to set up the structure for ansible to work with;
cd ansible-prometheus
mkdir -p roles/cloudalchemy.prometheus
mv defaults/ handlers/ meta/ molecule/ tasks/ templates/ vars/ roles/cloudalchemy.prometheus
now create a playbook to run the automation of the tasks
nano main.yaml
Then paste the following code into the file.
---
- hosts: all
  roles:
  - cloudalchemy.prometheus
  vars:
    prometheus_targets:
      node:
      - targets:
        - localhost:9100
        labels:
          env: demosite
awesome!, now our playbook is ready, let's go ahead and define our inventory file which is the target for ansible to execute the playbook against. create the inventory file as follows;
nano inventory
in the inventory file, input the following line;
localhost ansible_connection=local
save and exit ctrl + O, ENTER, ctrl + x
Let's run our ansible playbook to install Prometheus
ansible-playbook -i inventory main.yaml
After running the playbook, Prometheus should be successfully installed, to confirm;
prometheus --version
it should return some information about Prometheus
prometheus, version 2.27.0 (branch: HEAD, revision: 24c9b61221f7006e87cd62b9fe2901d43e19ed53)
  build user:       root@f27daa3b3fec
  build date:       20210512-18:04:51
  go version:       go1.16.4
  platform:         linux/amd64
Now Prometheus requires a Node exporter that will expose machine-level metrics, such as CPU, memory, disk space, etc. so that Prometheus will be able to fetch these metrics smoothly. Detailed instructions on installing a node exporter can be found here
After it has been installed successfully, we have to configure Prometheus to identify Node exporter as a target so as to be able to collect these metrics that are being exposed by the exporter. To modify the configuration file, run the following command;
sudo nano /etc/prometheus/prometheus.yml
go to the scrap config section and add a job for the node exporter with the following code;
- job_name: 'node'
  scrape_interval: 5s
  static_configs:
    - targets: ['<your server ip>:9100']
Your Prometheus config file should be looking like what i have below;
#
# Ansible managed
#
# http://prometheus.io/docs/operating/configuration/

global:
  evaluation_interval: 15s
  scrape_interval: 15s
  scrape_timeout: 10s

  external_labels:
    environment: ip-172-31-10-235.us-east-2.compute.internal


rule_files:
  - /etc/prometheus/rules/*.rules


scrape_configs:
  - job_name: prometheus
    metrics_path: /metrics
    static_configs:
    - targets:
      - ip-172-31-10-235.us-east-2.compute.internal:9090
  - file_sd_configs:
    - files:
      - /etc/prometheus/file_sd/node.yml
     job_name: node
  - job_name: 'node'
    scrape_interval: 5s
    static_configs:
      - targets: ['3.133.119.22:9100']
restart Prometheus with the following command;
sudo systemctl restart prometheus
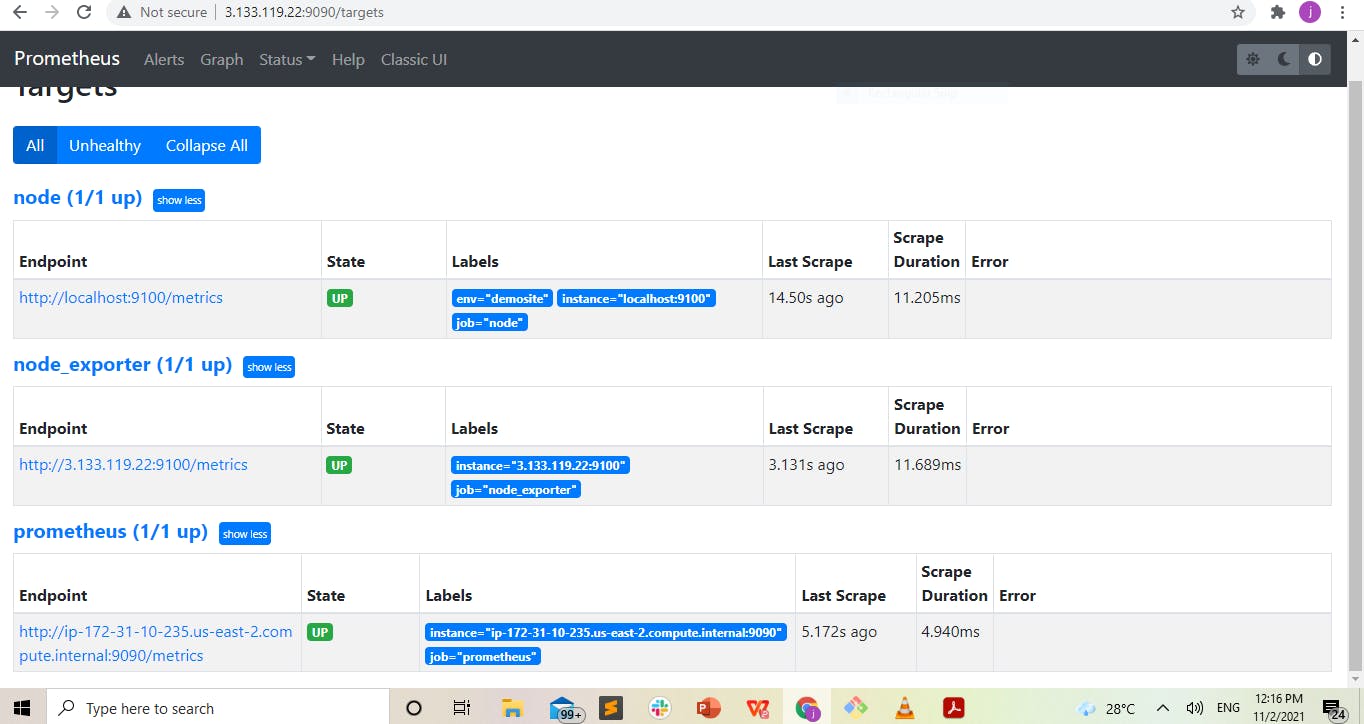
now let's take a look at the Prometheus server, go to your browser and enter the IP address of your server and port Prometheus is running on :9090, you should be able to see the following screen, after clicking on targets.
Although Prometheus comes with a built-in tool called PromQl to help you view your metrics, However in this article, we will be using Grafana because of its rich and comprehensive visualization dashboards.
Let's proceed with the installation of our second favorite tool which is Grafana. To install Grafana run the following commands;
sudo apt-get install -y adduser libfontconfig1
wget https://dl.grafana.com/enterprise/release/grafana-enterprise_8.2.2_amd64.deb
sudo dpkg -i grafana-enterprise_8.2.2_amd64.deb
Next, we would start the server and enable it with the following commands;
sudo systemctl start grafana-server
sudo systemctl enable grafana-server
To access the Grafana UI, you have to go to;
http://<your IP>:3000
You will be seeing something that looks like the image below;
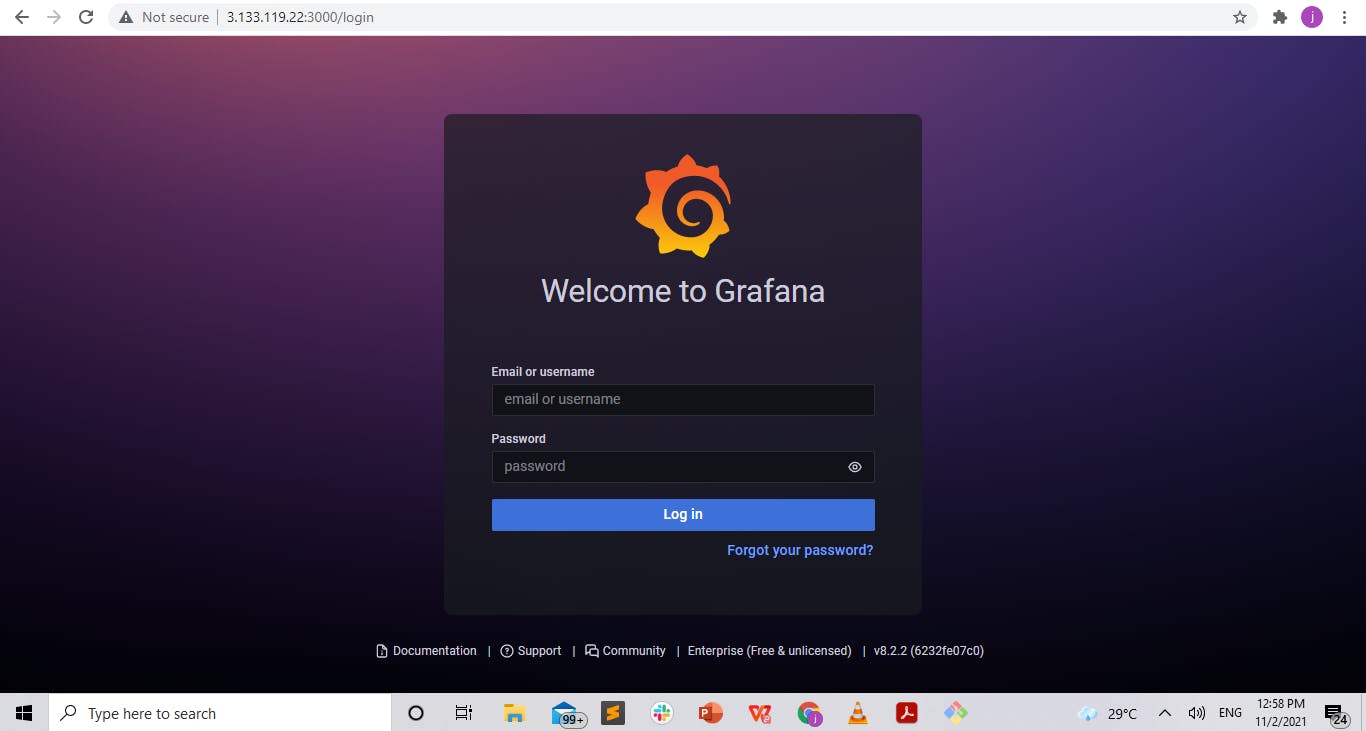
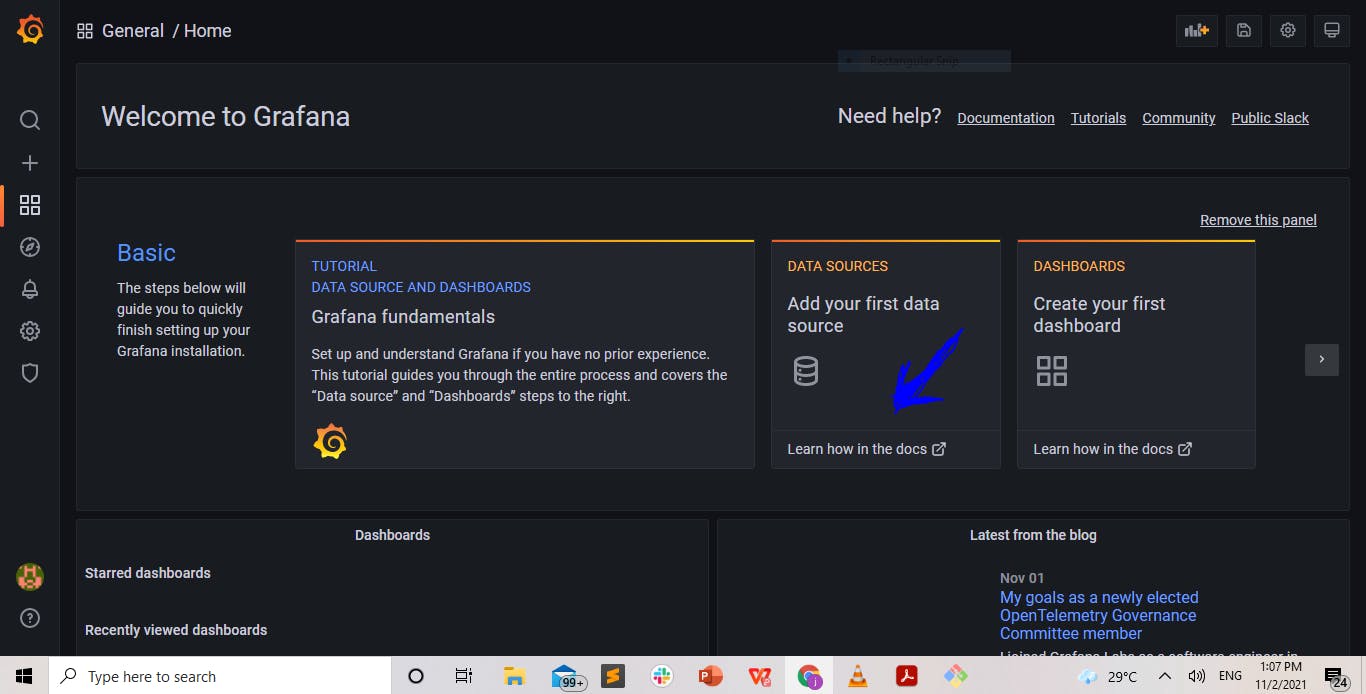
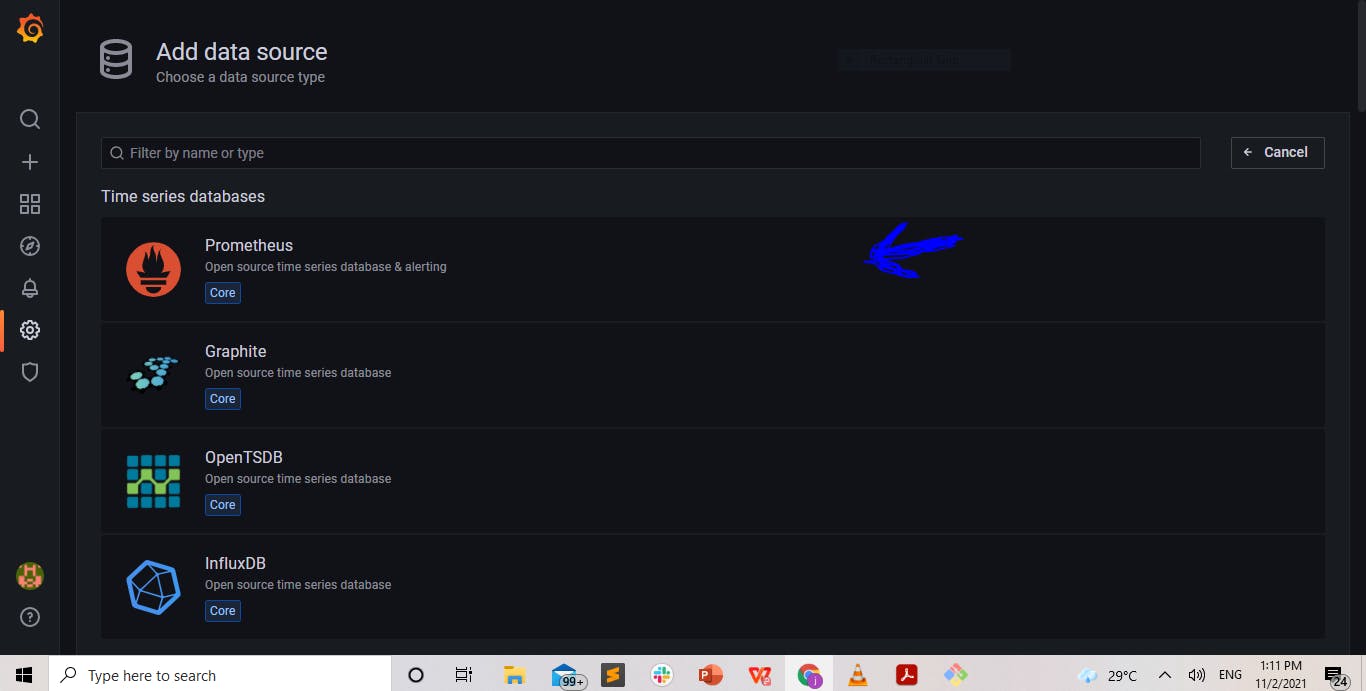
To login, the default username and password is "admin", however, you will be prompted to change your password after the first login (this is optional). After login in, click on add data source as shown below;
Now click on Prometheus as shown below;
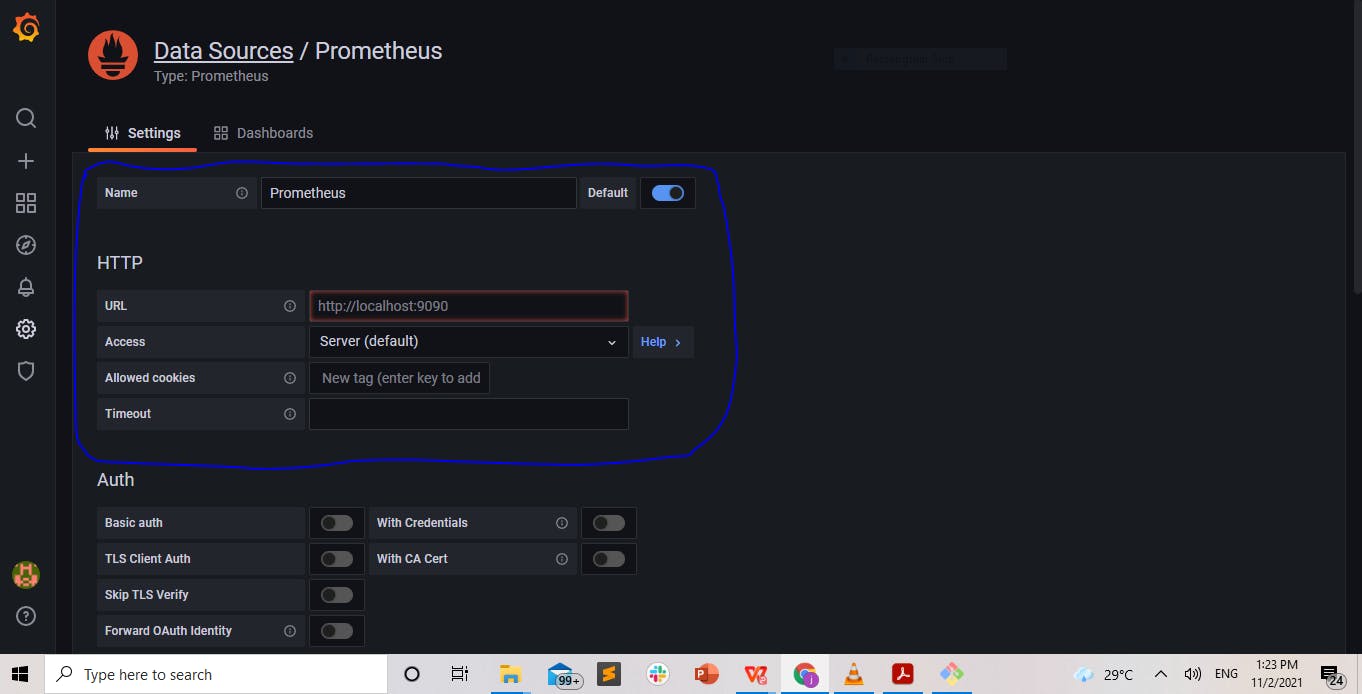
Then input the following values and leave the rest as defaults;
Name: Prometheus
URL: your server IP:9090
Access: Server
Click on Dashboards and import Prometheus stats as shown below;
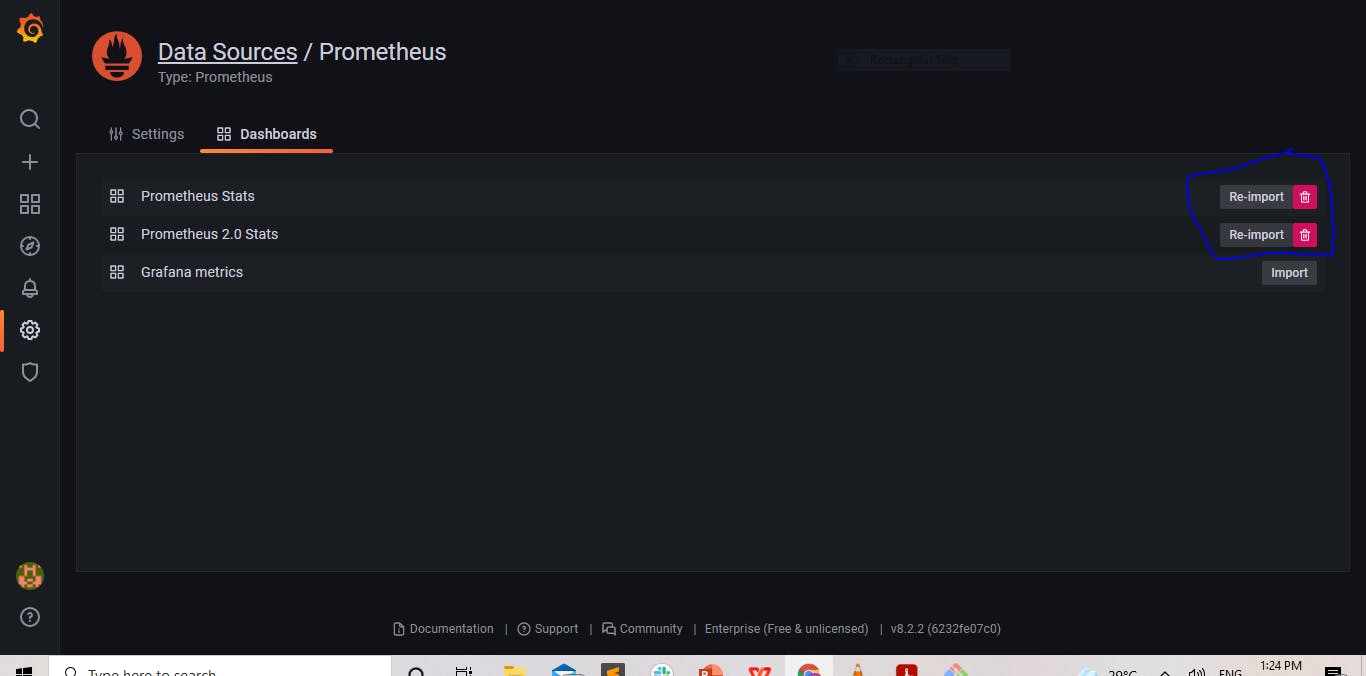
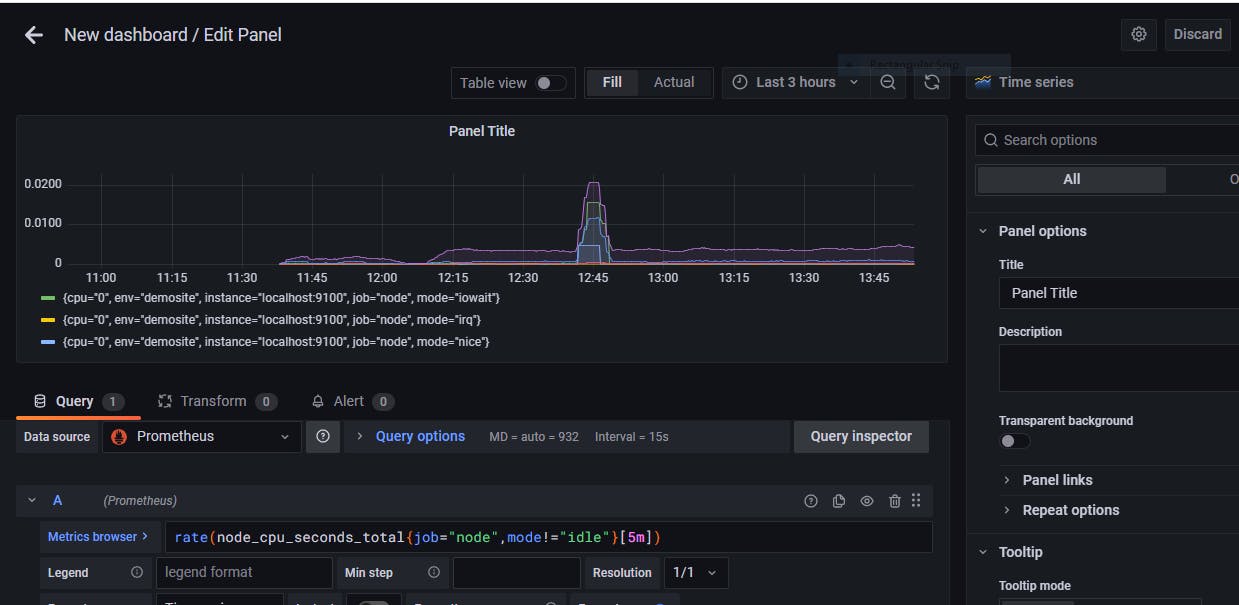
click on save and test. Now create a dashboard by clicking on the plus sign, then click on the new panel as shown below;
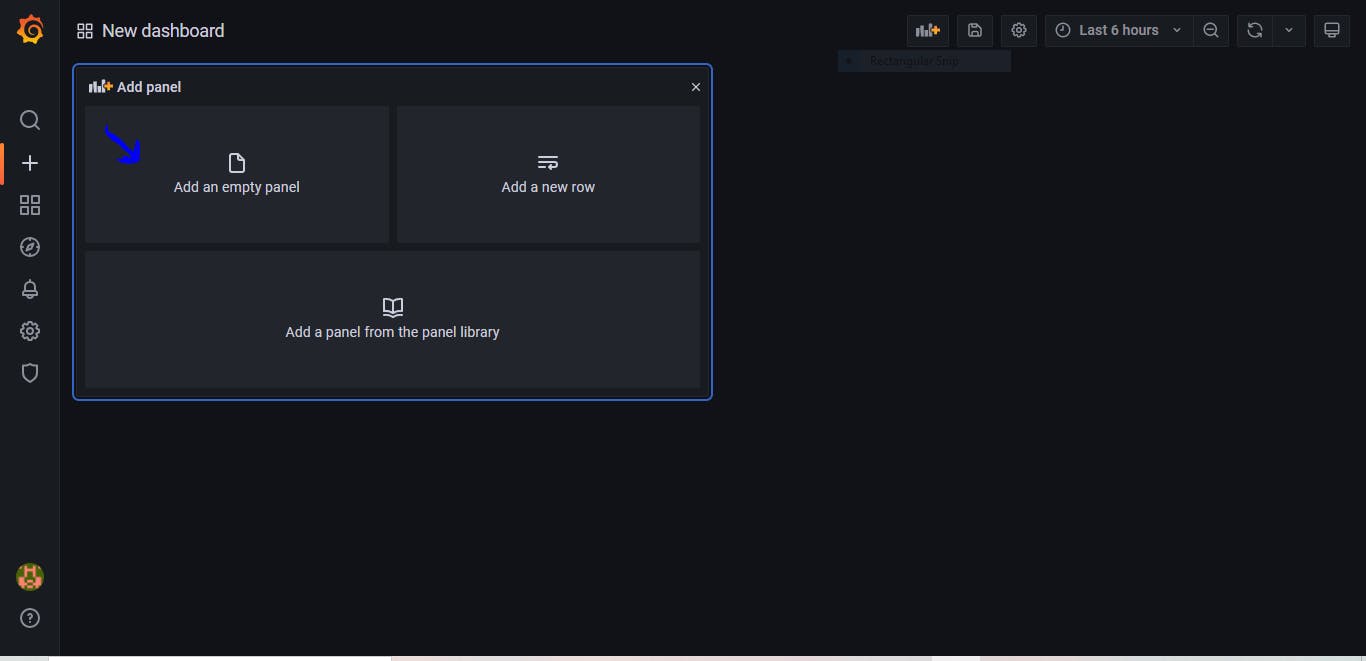
under the query section input the following query to display metrics about the node_cpu;
rate(node_cpu_seconds_total{job="node",mode!="idle"}[5m]
you should be seeing a graph as shown below;
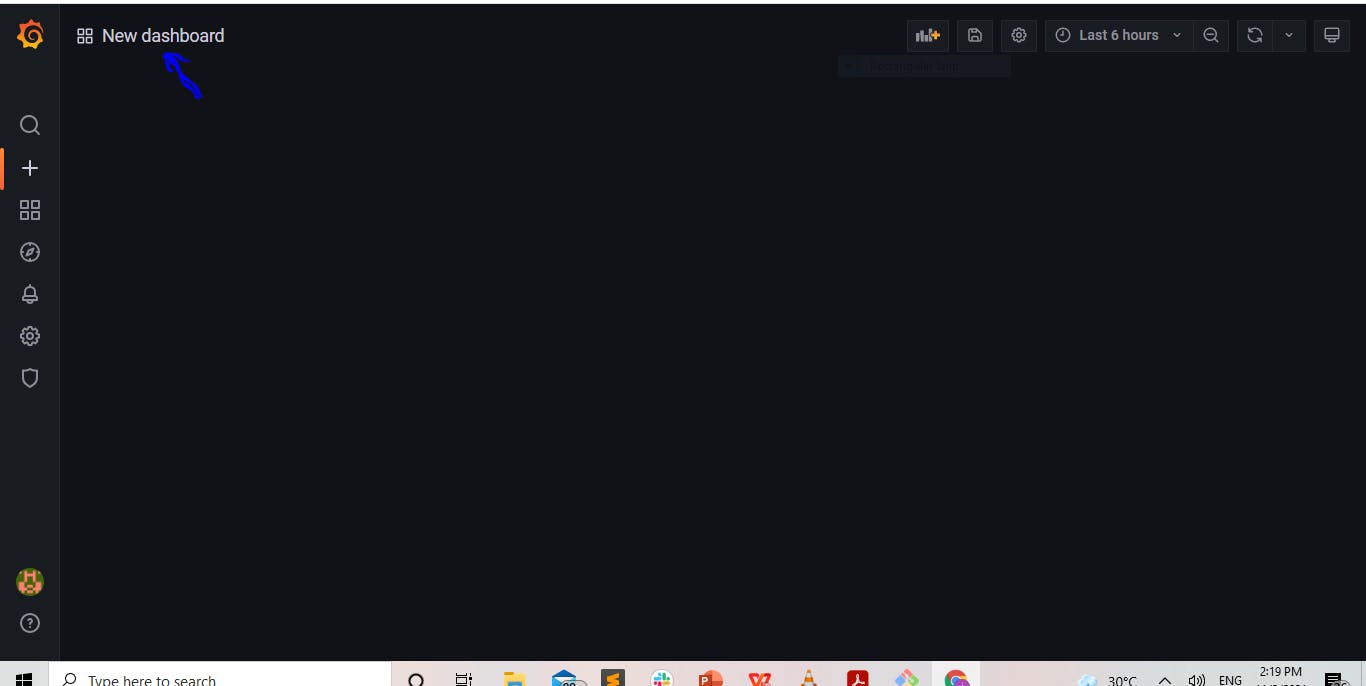
Alternatively, to see more information about Prometheus, you could click on the new dashboard as shown below;
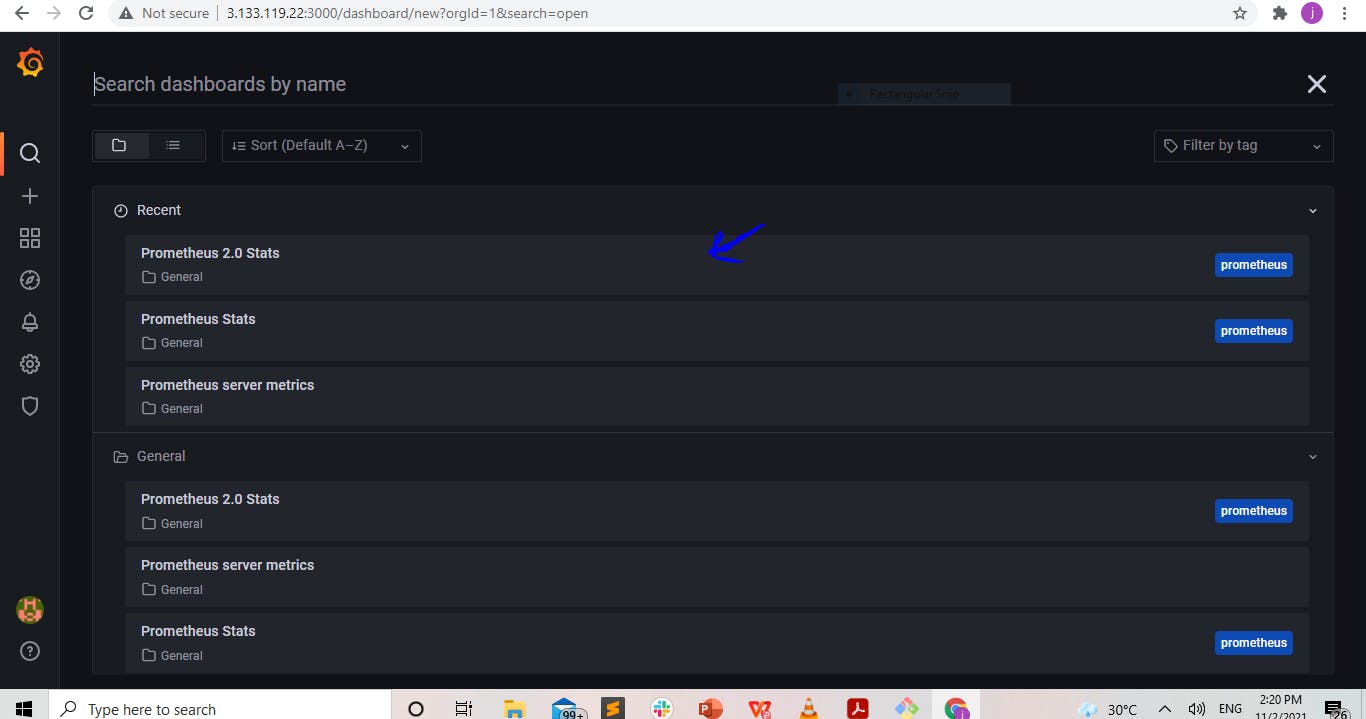
choose the data you imported earlier "Prometheus stats 2.0"
This should load much more comprehensive data about Prometheus as shown below;
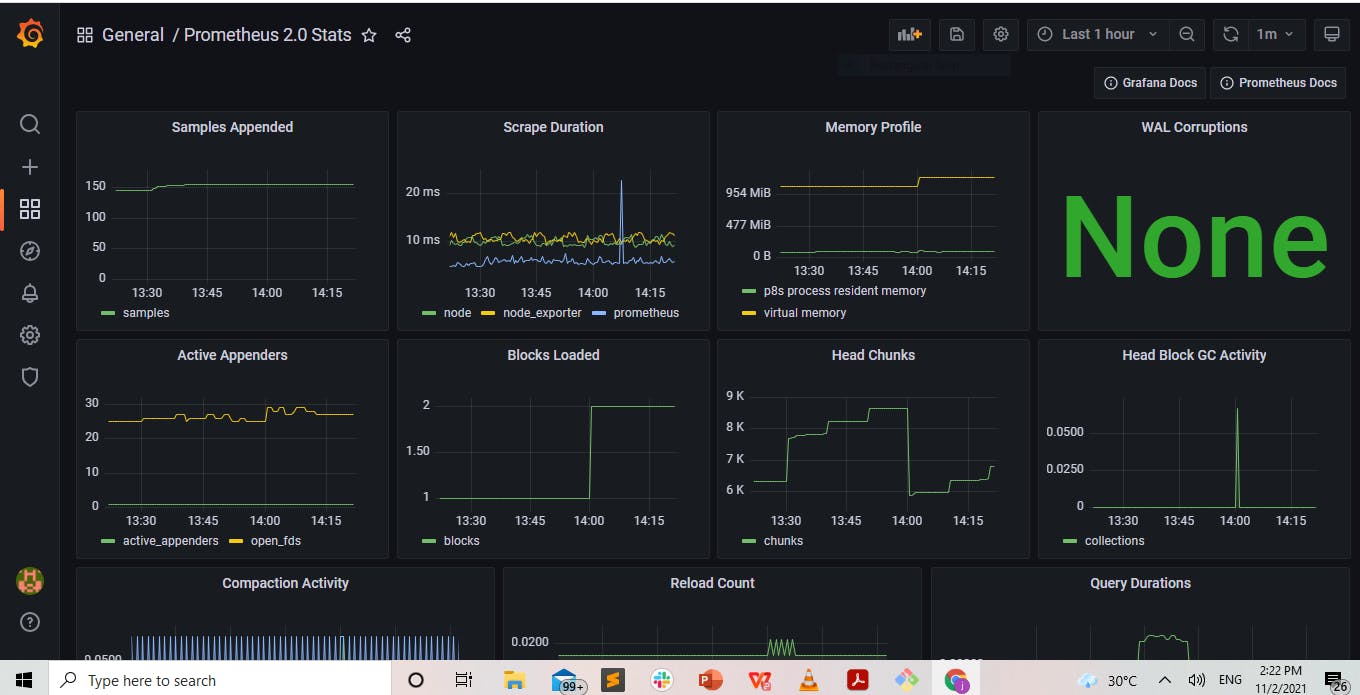
Congratulations! you have successfully installed and set up monitoring.
Conclusion
Monitoring/Observability is very broad, it goes beyond just getting system metrics, it also involves getting application metrics even in a distributed microservices architecture environment and this can be done by using Prometheus along with tools like Jaeger. It is also important to note that Prometheus itself can be used to achieve application monitoring by using instrumentation and client libraries that Prometheus supports, and Prometheus is an Open source tool that has support for a lot of client libraries. You can look into Prometheus documentation for more information, you can also learn more about Grafana here.
Thanks for following, feel free to like and share.